

SPECIAL REPORT: THE WAR IN THE GULF March 10, 2026
The twists and turns associated with military conflict are extraordinarily difficult to anticipate. Indeed, predicting investment markets, natural disasters and even long-term weather patterns seem easy by comparison and, for obvious reasons, the longer the conflict lasts, the greater the level of uncertainty.
Much of the challenge stems from the fact that each war is so different than its predecessors and has so many unique variables. However, despite these differences, history suggests that there has often been notable consistency in human behavior, herd instincts, and how large groups of people tend to react when confronted with the emotions of fear and greed.
Much of what follows leans heavily on these lessons of history and what they may imply about the current war in Iran. That said, we will start by emphasizing one of the most important of all lessons of history, which is that past performance is not necessarily indicative of future results.
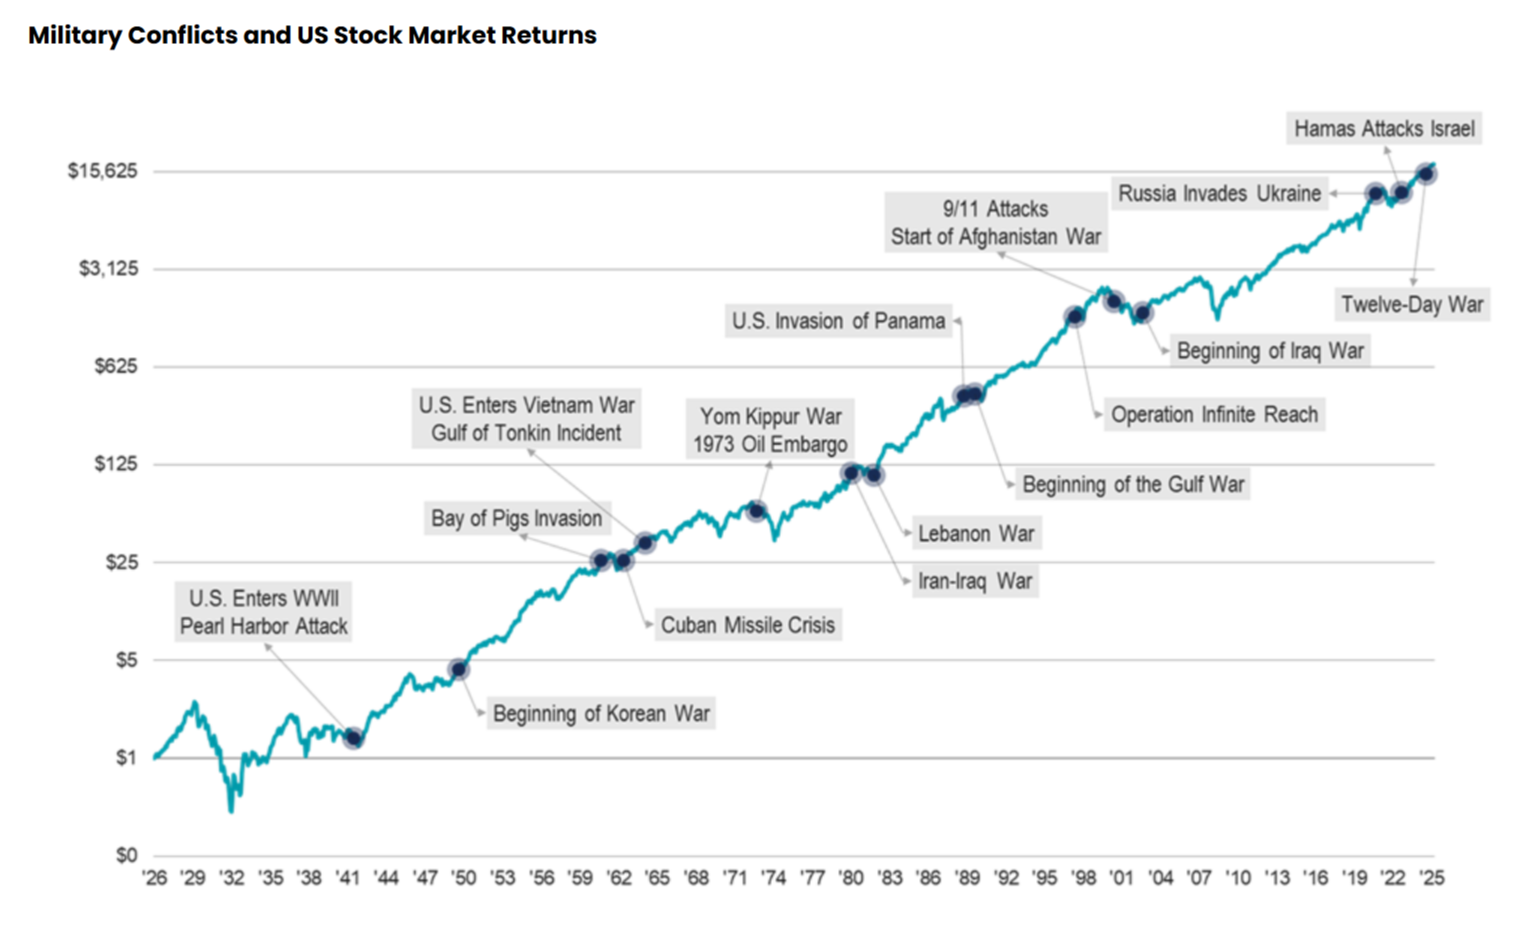
One of the lessons that we can take from the past is that geopolitical events in general, and military conflict in particular1, have historically almost never had a prolonged negative impact on the U.S. stock market, again keeping in mind that the past is not necessarily prologue.
That said, any conflict in the Gulf carries a special risk due to its potential influence on the price of oil, natural gas, and even fertilizers which, in turn, can have a significant impact on both economic growth and inflation. During the first week after the start of the War on Iran, West Texas intermediate crude oil futures surged 36% to $90.90 a barrel, which is the largest weekly percent gain on record.2 It is no coincidence that The Dow Jones Industrial Average suffered its worst weekly loss since April of last year, when the President announced his “Liberation Day” tariffs.
Moreover, during the first week of the war, the national average for gasoline prices increased by 32 cents (13%). If these prices hold the rest of the month, the gasoline rise alone would add 0.4% to an already undesirably high headline CPI (Consumer Price Index).3
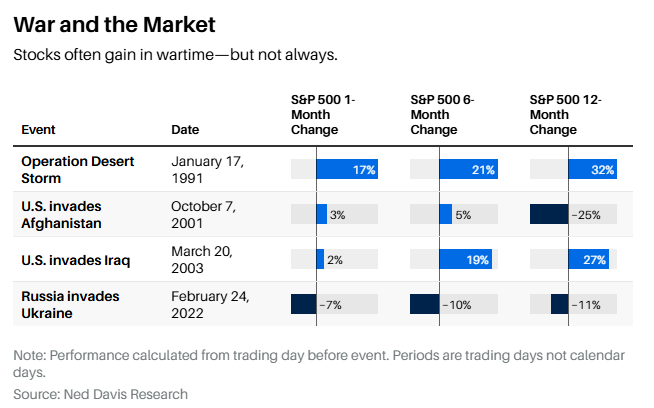
That said, it is at least noteworthy that, even with this additional risk of a short-term spike in oil and related commodity prices, previous wars in the region, including the 1991 Gulf War, the 2003 Iraq War, and last year’s bombing of Iran’s nuclear facilities, failed to weigh substantially on U.S. equity market returns.
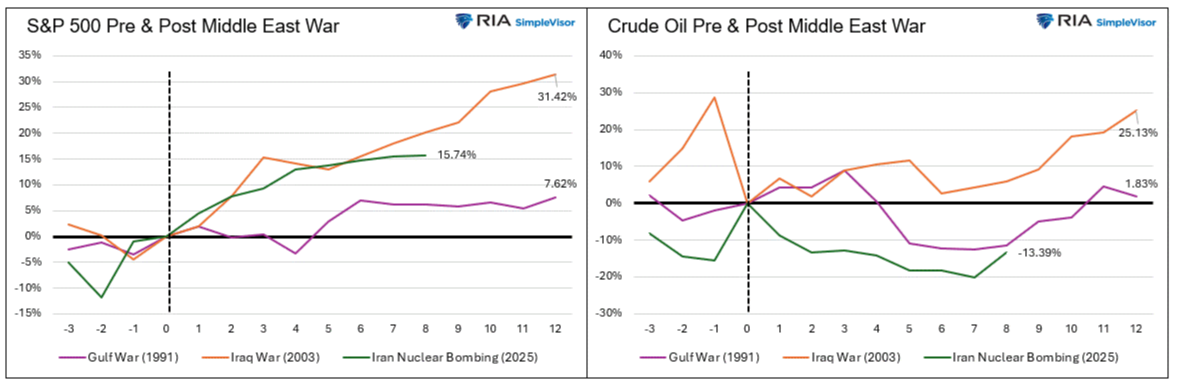
In the above charts4, the vertical line designates the starting date of each respective conflict, and the horizontal X-axis identifies the number of months immediately preceding or immediately following the date of each conflict’s beginning. Again, the past is no guarantee…
This time, the initial investor reaction was to sell off almost all of this year’s top-performing equity markets and asset classes and to rotate into the year-to-date laggards, such as the “Magnificent 7” stocks. Some of that selling seemed logical, such as selling equities in South Korea, Taiwan, and Western Europe, due to those economies (unlike the United States) being so dependent on the Middle East for their oil, liquified natural gas and gasoline supplies. Indeed, we view America’s energy independence as a major reason for the lack of substantial wartime losses for domestic stocks, at least to date.
However, in some other investments, like the traditional safe-harbor gold and silver markets, the intense selling seemed counterintuitive and much harder to explain, aside from the recent rebound in the U.S. dollar, and the fact that the general trend was for a strong rotation out of this year’s best performing investments, such as domestic small caps, precious metals, and international stocks, and into the year-to-date laggards.
Importantly, late last week, President Trump insisted not only on an unconditional surrender by Iran, but also that he have a determinative role in selecting the country’s next leader. If he maintains that condition, we have little doubt that it will prolong the conflict. We are similarly confident that the longer that the Strait of Hormuz remains effectively closed, the greater the risk of stagflation (a highly problematic combination of high inflation and slow economic growth) on a global basis.
In addition, we are concerned that the risk of higher inflation from an ongoing war effectively handcuffs the world’s major central banks and keeps them from lowering interest rates to help offset what could ultimately become a global recession, particularly if the war persists.
In light of this myriad of risks, there may be quite a temptation to become very defensive in one’s portfolio allocations. The potential problem with such an approach is that there is every possibility that the selling in equities will end well before the end of the war itself.5
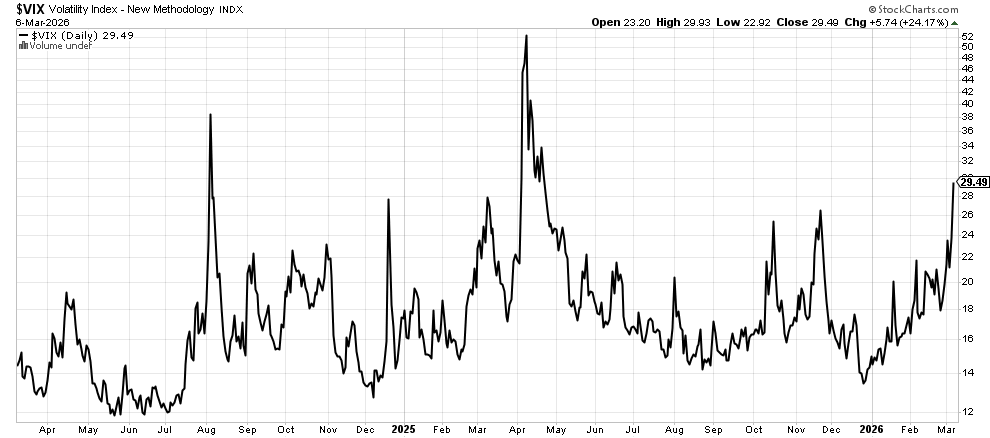
Indeed, most market declines end well before the worst of the bad news is realized and instead tend to reverse at the point of maximum pessimism, or when the worst-case scenario is almost fully priced into markets. While no indicator is a perfect gauge of that inflection point, there are certain indicators that can be very insightful. We have found that one of the most useful of those is the so-called “fear gauge” or VIX indicator.
According to DataTrek Research co-founder Nicholas Colas, the VIX closing above 27.2 reflects “enough investor uncertainty to consider adding equity exposure. That’s only happened three times during the current bull market. Each instance ended up being a good buying opportunity. The S&P 500 averaged a gain of 4.3% in the month following, with stocks gaining over the next three months in all three instances.”6
While it is certainly no guarantee that the markets have reached a selling climax and that investor sentiment has reached the aforementioned “point of maximum pessimism”, it is potentially quite important that the VIX index finished last week at a very elevated reading of 29.49, which is 8.41% higher than Colas’ benchmark level.
This represents the third highest “fear” reading in the past two years and is only exceeded by the August 2024 surprise rate hike by the Bank of Japan, which caused an aggressive deleveraging of global bond markets, and the April 2, 2025 announcement by President Trump of his “reciprocal tariffs”.
While there is no guarantee that history will be repeated, it is at least noteworthy that both previous instances provided opportune buying opportunities after the initial decline in equity prices.
The current situation in the Gulf is both volatile and very fluid, and we will continue to monitor it very closely. In the meantime, we remain mindful of another lesson from history which is that, while it may be prudent at times to moderate portfolio risk in a measured and thoughtful way, over-reacting by making emotionally driven portfolio changes has often proven counterproductive.
Disclosures
Advisory services offered through Per Stirling Capital Management, LLC. Securities offered through B. B. Graham & Co., Inc., member FINRA/SIPC. Per Stirling Capital Management, LLC, DBA Per Stirling Private Wealth and B. B. Graham & Co., Inc., are separate and otherwise unrelated companies.
This material represents an assessment of the market and economic environment at a specific point in time and is not intended to be a forecast of future events, or a guarantee of future results. Forward-looking statements are subject to certain risks and uncertainties. Actual results, performance, or achievements may differ materially from those expressed or implied. Information is based on data gathered from what we believe are reliable sources. It is not guaranteed as to accuracy, does not purport to be complete and is not intended to be used as a primary basis for investment decisions. It should also not be construed as advice meeting the particular investment needs of any investor.
Nothing contained herein is to be considered a solicitation, research material, an investment recommendation or advice of any kind. The information contained herein may contain information that is subject to change without notice. Any investments or strategies referenced herein do not take into account the investment objectives, financial situation or particular needs of any specific person. Product suitability must be independently determined for each individual investor.
This document may contain forward-looking statements based on Per Stirling Capital Management, LLC’s (hereafter PSCM) expectations and projections about the methods by which it expects to invest. Those statements are sometimes indicated by words such as “expects,” “believes,” “will” and similar expressions. In addition, any statements that refer to expectations, projections or characterizations of future events or circumstances, including any underlying assumptions, are forward-looking statements. Such statements are not guarantying future performance and are subject to certain risks, uncertainties and assumptions that are difficult to predict. Therefore, actual returns could differ materially and adversely from those expressed or implied in any forward-looking statements as a result of various factors. The views and opinions expressed in this article are those of the authors and do not necessarily reflect the views of PSCM’s Investment Advisor Representatives.
Past performance is no guarantee of future results. The investment return and principal value of an investment will fluctuate so that an investor's shares, when redeemed, may be worth more or less than their original cost. Current performance may be lower or higher than the performance quoted.
Investing internationally carries additional risks such as differences in financial reporting, currency exchange risk, as well as economic and political risk unique to the specific country. This may result in greater share price volatility. Shares, when sold, may be worth more or less than their original cost.
Indices are unmanaged and investors cannot invest directly in an index. Unless otherwise noted, performance of indices does not account for any fees, commissions or other expenses that would be incurred. Returns do not include reinvested dividends.
Definitions
The Standard & Poor's 500 (S&P 500) is a market-capitalization-weighted index of the 500 largest publicly-traded companies in the U.S with each stock's weight in the index proportionate to its market. It is not an exact list of the top 500 U.S. companies by market capitalization because there are other criteria to be included in the index.
The Dow Jones Industrial Average (DJIA) is a price-weighted average of 30 actively traded “blue chip” stocks, primarily industrials, but includes financials and other service-oriented companies. The components, which change from time to time, represent between 15% and 20% of the market value of NYSE stocks.
The VIX or Volatility Index – Shows the market's expectation of 30 – day volatility. It is constructed using the implied volatilities of a wide range of S&P 500 index options. The VIX is a widely used measure of market risk and is often referred to as the "investor fear gauge".
Small capitalization securities involve greater issuer risk than larger capitalization securities, and the markets for such securities may be more volatile and less liquid. Specifically, small capitalization companies may be subject to more volatile market movements than securities of larger, more established companies, both because the securities typically are traded in lower volume and because the issuers typically are more subject to changes in earnings and prospects.
Citations
- “What History Teaches Investors About Geopolitical Conflict”, Michael Preis, Posted 3/5/2026, https://tciwealth.com/blog/markets-geopolitical-conflicts-investing-discipline/
- “Dow Slides as Stagflation Worries Roil Markets”, Connor Smith, Posted 3/6/2026, https://tciwealth.com/blog/markets-geopolitical-conflicts-investing-discipline/
- “What We’re Reading”, Bianco Research, Posted 3/6/2026, https://www.biancoresearch.com/what-were-reading-280/
- “War Headlines Drive Volatility — History Suggests a Different Market Outcome”, Lance Roberts, Posted 3/5/2026, War Headlines Drive Volatility — History Suggests a Different Market Outcome | Advisorpedia
- “What We’re Reading”, Bianco Research, Posted 3/6/2026, https://www.biancoresearch.com/what-were-reading-280/
- “Volatility Is Surging. Here’s the Level It Becomes a Buy Signal for Stocks.”, Josh Schafer, Posted 3/3/2026, https://www.barrons.com/articles/volatility-is-surging-heres-the-level-it-becomes-a-buy-signal-for-stocks-cbea74fc?gaa_at=eafs&gaa_n=AWEtsqflv55S