


We commemorate the launch of our new Outlook format with the above sculpture of Janus, which we believe only makes sense, as Janus was not only the ancient Roman god of beginnings, endings and transitions, but also the two-faced god, which seems doubly appropriate, as our new format is intended to offer both a retrospective of the quarter just past and a prospective on the quarter to come.
With the benefit of hindsight, the most noteworthy characteristic of the just-concluded third quarter may be that it was anything but ordinary, particularly from an equity market perspective. Normally, the third quarter of the year is known for high volatility and disappointing returns. However, the third quarter of 2025 deviated sharply from this long-standing market tendency and included the strongest September returns for the domestic equity markets since 2010, the strongest third quarter for the Russell 2000 Small-Cap index since 20091, and each of the major domestic stock indices hitting new all-time highs during the period.
During the third quarter, the Dow Jones Industrial Average posted an impressive return of 5.67%, which actually seems somewhat modest when you consider that the NASDAQ Composite gained 11.41%, and the Standard & Poor’s 500 Index advanced by 8.12%. Smaller capitalization stocks also enjoyed a strong quarter, with the S&P 400 Mid-Cap Index and S&P 600 Small-Cap Index gaining 5.55% and 9.11% respectively. Even the generally lower-quality Russell 2000 Small-Cap Index rocketed higher by a remarkable 12.39%.2
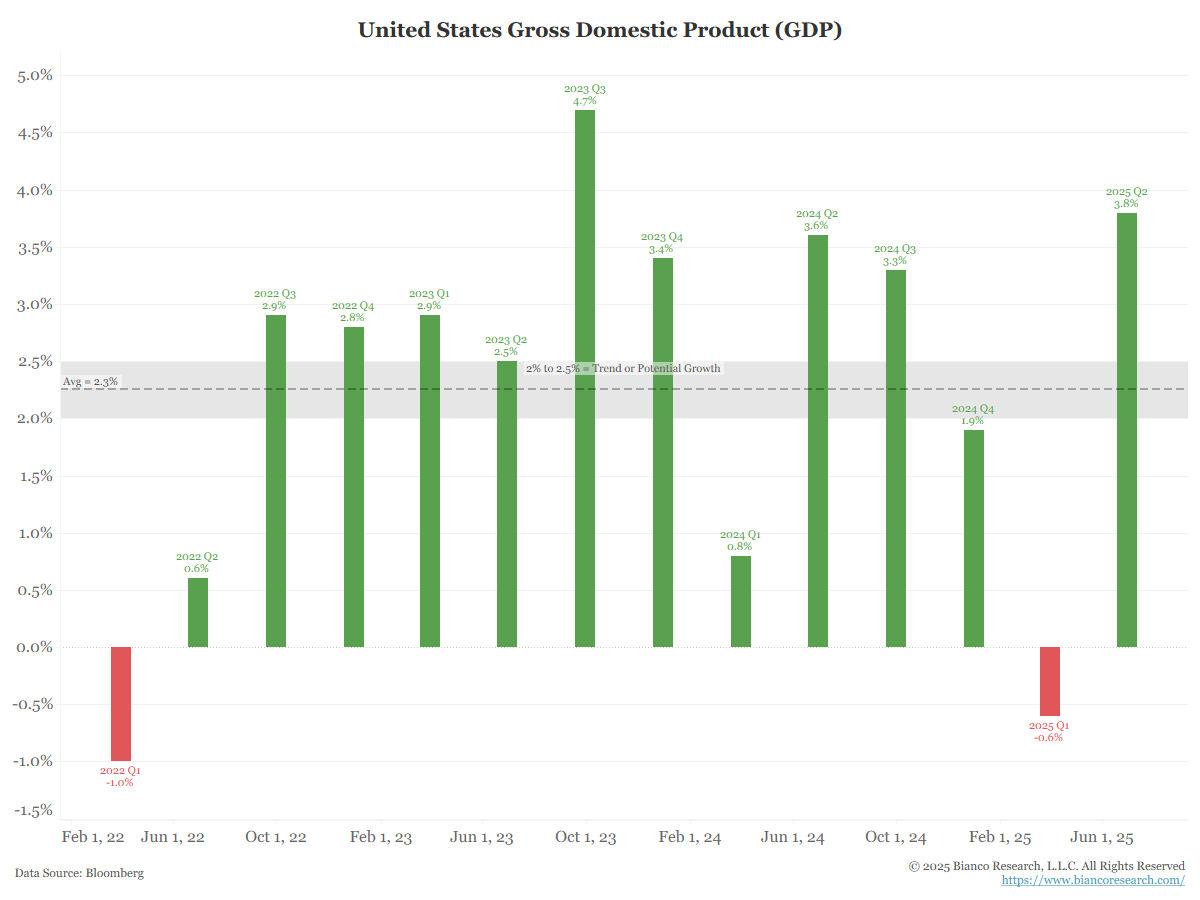
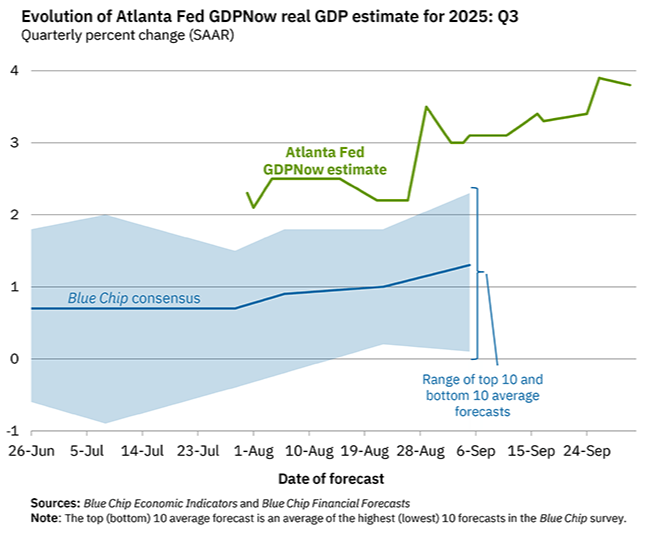
So, what explains these impressive returns, especially during this normally sub-par time of year? To start with, the U.S. economy is demonstrating remarkable resilience, having exceeded its perceived 2.0% to 2.5% sustainable growth rate (grey horizonal line above) in nine of the past twelve quarters and, with the Atlanta Fed Nowcast (below) estimating a very brisk 3.8% current growth rate (net of inflation), there are few signs that the rather dramatic slowdown in job creation is spreading to the overall economy, at least not yet.
However, we believe that the reasons for current investor optimism extend well beyond the strength of the economy. Other catalysts include the fact that corporate earnings continue to come in stronger than expected, that artificial intelligence-driven capital investment continues to accelerate, and that credit spreads are near all-time lows, which is historically very bullish for equity prices. Credit spreads define the amount of additional yield investors are demanding to compensate them for the risk of investing in less highly rated bonds.
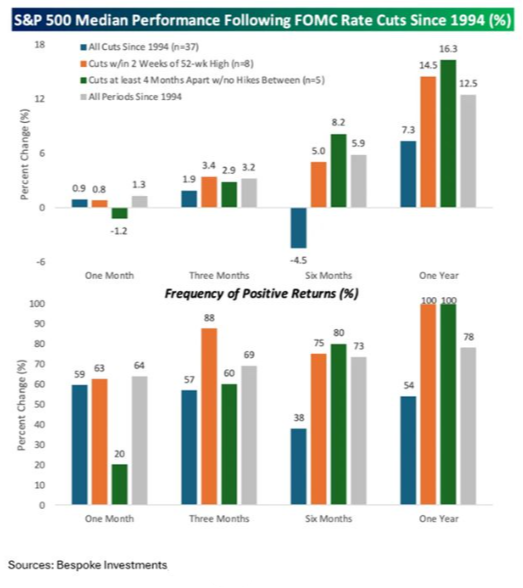
If that were not enough, the Fed has resumed its interest rate cuts in response to slowing job creation, and this is despite the economy’s still impressive growth rate and the lingering (and we believe well justified) concerns over rising inflation. As we noted in our September commentary, “lower interest rates have historically been very supportive of stock prices, particularly when they take place when stocks are already near record highs and/or when they represent a resumption of interest rate cuts after an extended pause. While the past is not necessarily prologue, it may be worth noting that both conditions exist today.” Adding economic fuel to the fire is the literally trillions of dollars of fiscal stimulus that will start to impact the economy next year as part of the budget-busting “One Big Beautiful Bill Act”.
While not quite so impressive as the domestic returns, foreign markets also enjoyed an unusually strong quarter, with European stocks averaging a 3.62% return, developed Pacific region stocks posting an average gain of 7.11% and emerging markets like China, India and Brazil averaging impressive quarterly gains of 10.64%.3 While earnings were generally less impressive, most foreign equity markets benefited from having much lower valuations (based on both trailing and expected earnings) than do most domestic stocks.
The Fed’s resumed cutting of short-term interest rates also served to mollify some investor concerns about rising inflation, thus helping the fixed income markets to post modest quarterly gains. Treasuries gained between 1.03% and 2.10% during the quarter, depending on their duration, and investment-grade debt averaged quarterly returns of 2.57%, while lower-quality, high-yield bonds averaged quarterly gains of 2.54%. Over the course of Q3, municipal bonds averaged returns of 3.00%, while overseas fixed-income markets averaged quarterly losses of -1.13%.4 Constraining foreign bonds was both a likely end to rate cuts in Europe and ongoing rate hikes in Japan.
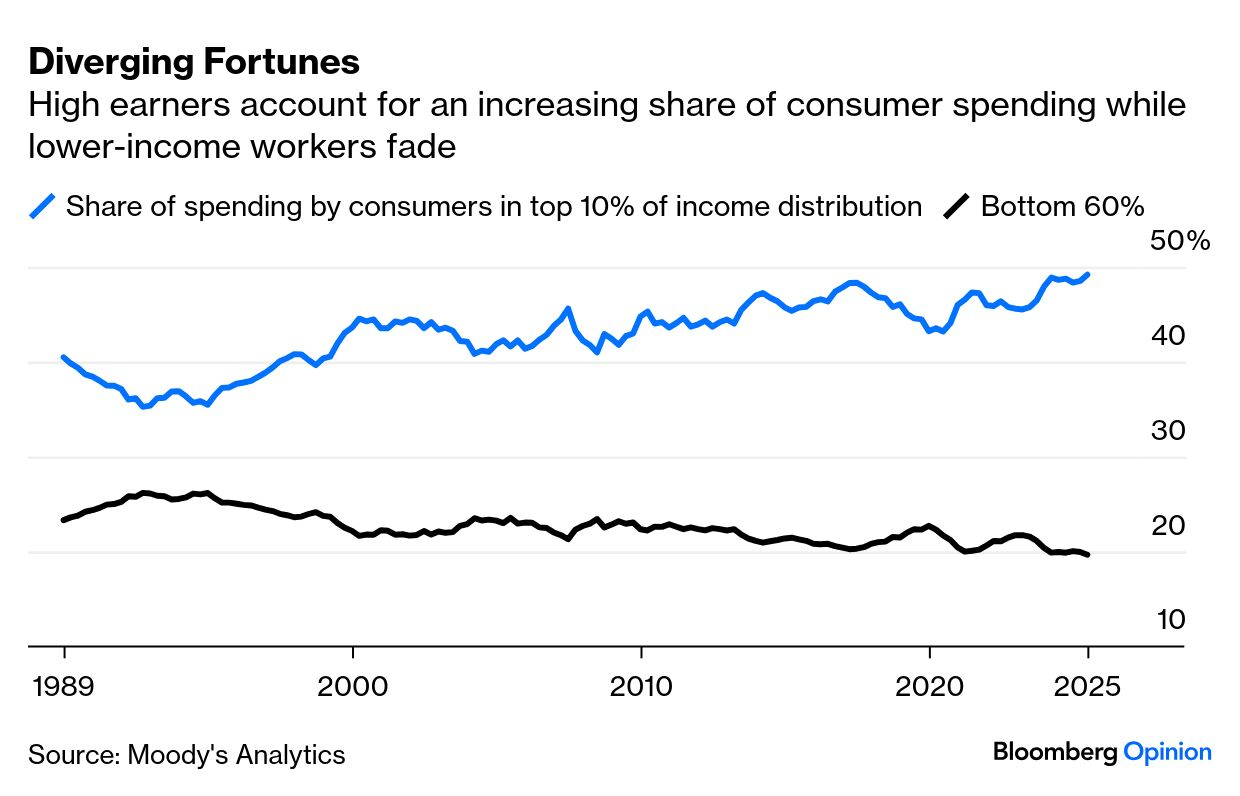
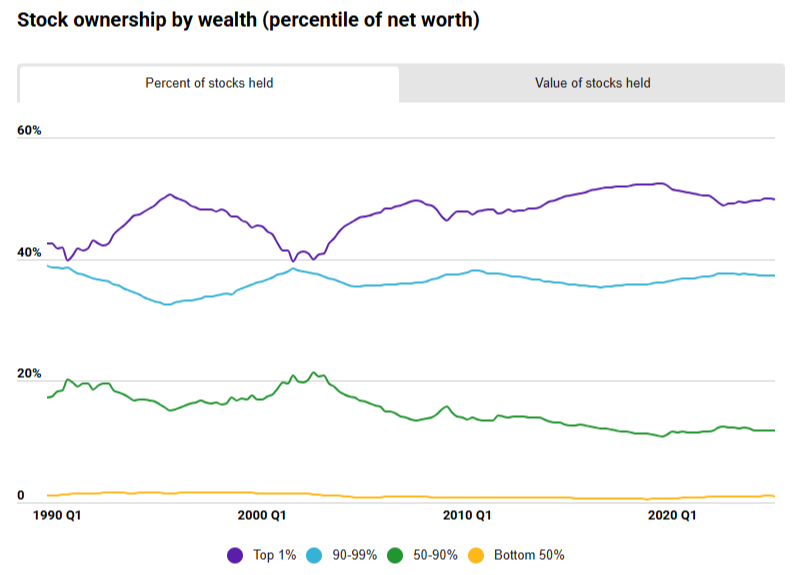
Importantly, there seems to exist a symbiotic relationship between domestic equity returns and the strength of the economy. Specifically, at present, the wealthiest 10% of the population accounts for almost one-half of all consumer spending (blue line above). This same 10% of the population also owns over 87% of all U.S. stocks. By contrast, the bottom 50% of the population (by wealth) owns less than 1% of all stocks.5.
We view these factors as potentially very important, as almost 70% of the entire economy (GDP) is directly attributable to consumer spending6, and because we believe that there are indications that we are seeing a self-reinforcing “wealth effect”, where portfolio gains are encouraging more consumer spending by the more affluent, which is driving a stronger economy, which is boosting corporate earnings, which is driving higher stock prices , which is increasing consumer spending, which is strengthening the economy, and so on and so on.
To be clear, there are a variety of things to worry about. Inflation is moving higher from what are already undesirably high levels, and there is a risk that it will be exacerbated by the combination of rate cuts, fiscal stimulus, tariffs and the current immigration policies. Also, job creation is slowing to a crawl, largely due to the U.S.’s cratering population growth, the downsizing of the federal government, and the impact of artificial intelligence. While the impact of this on the overall economy seems quite muted to-date, it is likely just a matter of time before the lack of job creation will impact consumer spending and then ultimately economic growth. The same could be true of an extended government shutdown.
Then there is the fact that, based upon traditional valuation measures like price-to-book value and price-to-earnings, the U.S. equity markets are very highly valued. Indeed, based upon many such measures, the U.S. stock market is currently trading at among its highest valuations ever7, and the Standard & Poor’s 500 Index is trading at between one and two standard deviations above its average valuation (see the chart below), which is one of the reasons why we continue to diversify internationally, despite the somewhat less compelling market fundamentals overseas.
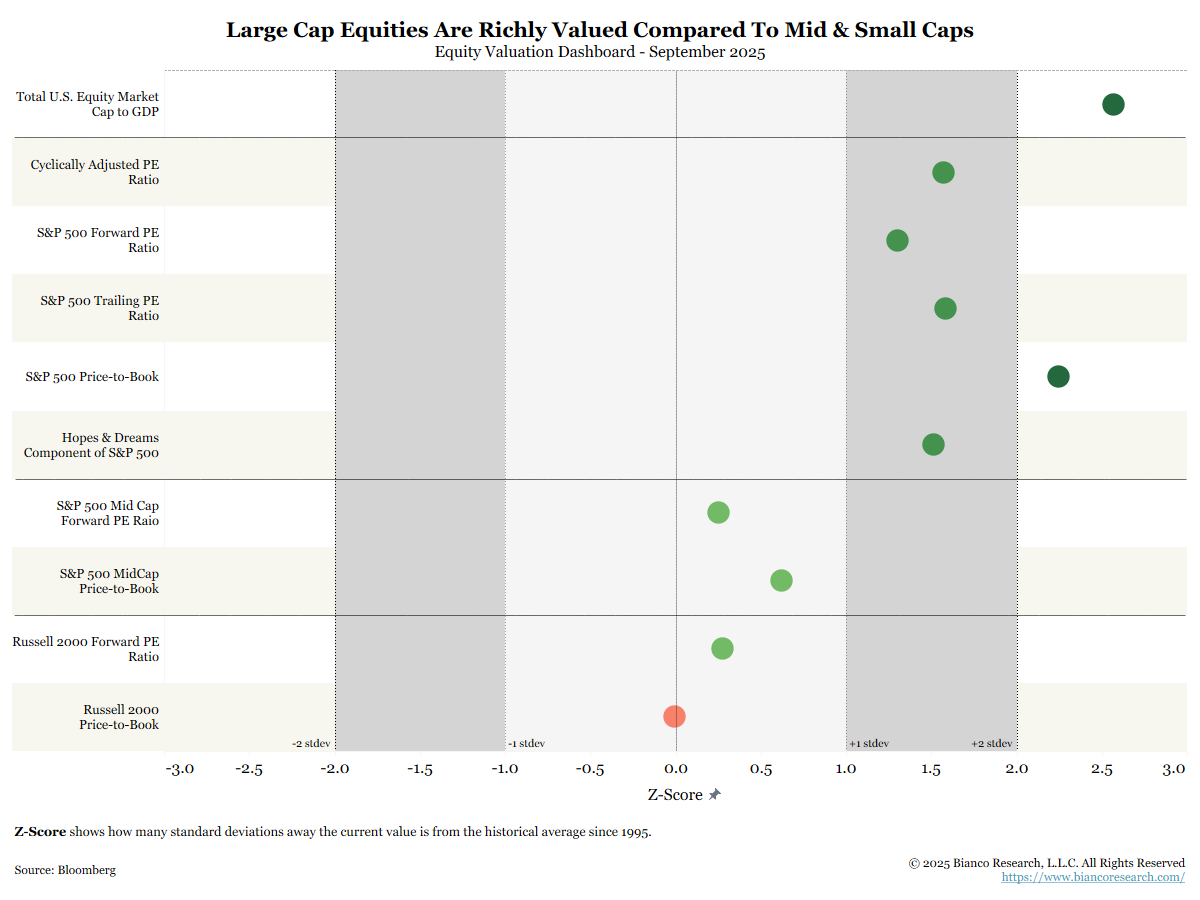
At the same time, there are those, like Bank of America/Merrill Lynch’s Head of US Equity & Quantitative Strategy, Savita Subramanian, who maintains that, due to “less financial leverage, lower earnings volatility, increased efficiency and more stable margins” stock valuations are justified and that “perhaps we should anchor to today’s multiples as the new normal rather than expecting mean reversion to a bygone era.”8.
In addition to high valuations and very narrow market leadership, there is a growing speculative element in the domestic stock market. Indeed, according to J.P.Morgan, "AI related stocks have accounted for 75% of S&P 500 returns, 80% of earnings growth, and 90% of capital spending growth since ChatGPT launched" in November of 2022.9
Time will tell if this is, in fact, a new paradigm, but we are always mindful of Sir John Templeton’s cautionary warning that the four most dangerous words in investing are "this time it's different".
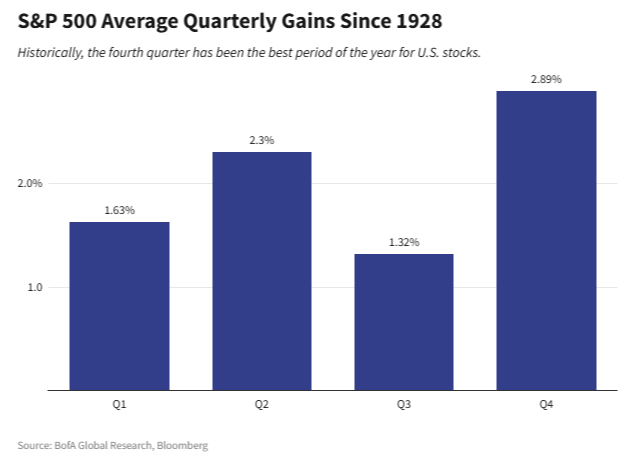
That said, almost all of the positives that drove the third quarter’s outstanding equity market returns are still in place and, while we would not be in the least bit surprised if the equity markets experienced some profit-taking, or at least a pause, we are entering into what has historically been the best performing season of the year (particularly over the past 30 years)10. While a bearish catalyst will ultimately emerge, we see relatively few signs of an imminent threat to the domestic equity market’s current upside momentum.
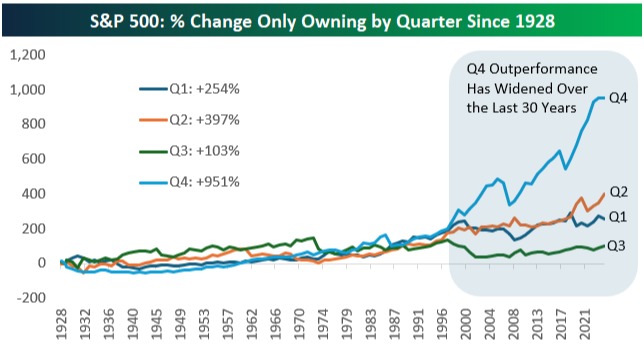
Indeed, while the past is not necessarily indicative of future results, the fourth quarter has historically tended to be a continuation of the first three quarters of the year. As evidence, since 1928, the S&P 500 has advanced during the fourth quarter over 83% of the time (and averaged 4.41% fourth quarter returns) in years when the first three quarters produced positive returns. Even more impressive is the fact that, since 1990, a positive first-three- quarter return for the S&P 500 has led to a positive fourth quarter over 88% of the time, and by a very impressive average gain of 6.05%.
In regard to our expectations for the bond markets over the remainder of the year, our opinion might be best described as cautiously neutral. On the bullish side, we do expect for the Federal Reserve to cut short-term interest rates one or two more times this year. On the other hand, we are concerned about both the huge surge in the supply of new debt and the risk of problematic inflation, particularly in light of the expected increase in both monetary and fiscal stimulus.
In this environment, we favor investment grade corporate debt over both Treasuries and high-yield debt. Given the very narrow difference in yield between short and longer maturity debt, we also prefer to invest in debt that matures in the next two to five years. We are also comfortable investing in short term debt, which we generally prefer over money markets. Regardless of duration, we prefer to invest in higher quality debt, as opposed to lower-quality, higher-yielding securities.
All things considered, we maintain a cautiously optimistic outlook for the fourth quarter of the year.
Disclosures
Advisory services offered through Per Stirling Capital Management, LLC. Securities offered through B. B. Graham & Co., Inc., member FINRA/SIPC. Per Stirling Capital Management, LLC, DBA Per Stirling Private Wealth and B. B. Graham & Co., Inc., are separate and otherwise unrelated companies.
This material represents an assessment of the market and economic environment at a specific point in time and is not intended to be a forecast of future events, or a guarantee of future results. Forward-looking statements are subject to certain risks and uncertainties. Actual results, performance, or achievements may differ materially from those expressed or implied. Information is based on data gathered from what we believe are reliable sources. It is not guaranteed as to accuracy, does not purport to be complete and is not intended to be used as a primary basis for investment decisions. It should also not be construed as advice meeting the particular investment needs of any investor.
Nothing contained herein is to be considered a solicitation, research material, an investment recommendation or advice of any kind. The information contained herein may contain information that is subject to change without notice. Any investments or strategies referenced herein do not take into account the investment objectives, financial situation or particular needs of any specific person. Product suitability must be independently determined for each individual investor.
This document may contain forward-looking statements based on Per Stirling Capital Management, LLC’s (hereafter PSCM) expectations and projections about the methods by which it expects to invest. Those statements are sometimes indicated by words such as “expects,” “believes,” “will” and similar expressions. In addition, any statements that refer to expectations, projections or characterizations of future events or circumstances, including any underlying assumptions, are forward-looking statements. Such statements are not guarantying future performance and are subject to certain risks, uncertainties and assumptions that are difficult to predict. Therefore, actual returns could differ materially and adversely from those expressed or implied in any forward-looking statements as a result of various factors. The views and opinions expressed in this article are those of the authors and do not necessarily reflect the views of PSCM’s Investment Advisor Representatives.
Past performance is no guarantee of future results. The investment return and principal value of an investment will fluctuate so that an investor's shares, when redeemed, may be worth more or less than their original cost. Current performance may be lower or higher than the performance quoted.
Investing internationally carries additional risks such as differences in financial reporting, currency exchange risk, as well as economic and political risk unique to the specific country. This may result in greater share price volatility. Shares, when sold, may be worth more or less than their original cost.
Definitions
Indices are unmanaged and investors cannot invest directly in an index. Unless otherwise noted, performance of indices does not account for any fees, commissions or other expenses that would be incurred. Returns do not include reinvested dividends.
The Standard & Poor's 500 (S&P 500) is a market-capitalization-weighted index of the 500 largest publicly-traded companies in the U.S with each stock's weight in the index proportionate to its market. It is not an exact list of the top 500 U.S. companies by market capitalization because there are other criteria to be included in the index.
The Russell 2000 Index is a small-cap U.S. stock market index that makes up the smallest 2,000 stocks in the Russell Index.
The Dow Jones Industrial Average (DJIA) is a price-weighted average of 30 actively traded “blue chip” stocks, primarily industrials, but includes financials and other service-oriented companies. The components, which change from time to time, represent between 15% and 20% of the market value of NYSE stocks.
The Nasdaq Composite Index is a market-capitalization weighted index of the more than 3,000 common equities listed on the Nasdaq stock exchange. The types of securities in the index include American depositary receipts, common stocks, real estate investment trusts (REITs) and tracking stocks. The index includes all Nasdaq listed stocks that are not derivatives, preferred shares, funds, exchange-traded funds (ETFs) or debentures.
This Standard & Poor's Midcap 400 Index is a market weighted index that serves as a barometer for the U.S. mid-cap equities sector. To be included in the index, a stock must have a total market capitalization that ranges from roughly $750 million to $3 billion dollars. Stocks in this index represent household names from all major industries including energy, technology, healthcare, financial and manufacturing.
The S&P SmallCap 600 Index, more commonly known as the S&P 600, is a stock market index from Standard & Poor's that covers the small-cap range of US stocks, using a capitalization-weighted index. The index covers roughly three percent of the total US stock market.
Small capitalization securities involve greater issuer risk than larger capitalization securities, and the markets for such securities may be more volatile and less liquid. Specifically, small capitalization companies may be subject to more volatile market movements than securities of larger, more established companies, both because the securities typically are traded in lower volume and because the issuers typically are more subject to changes in earnings and prospects.
Citations
Opening Image: “Janus”, Loudon Dodd, Published on 07/04/2016, https://www.worldhistory.org/image/5280/janus/
- “Stocks end third quarter on high note as Dow clinches record, Big Tech extends gains as AI trade rolls on”, Allie Canal, Posted 9/30/2025 https://finance.yahoo.com/news/stocks-end-third-quarter-on-high-note-as-dow-clinches-record-big-tech-extends-gains-as-ai-trade-rolls-on-211744004.html?guce_referrer=aHR0cHM6Ly93d3cuYmluZy5jb20v&guce_referrer_sig=AQAAAJ7GfKhq9bZlTbD2syhNPxCY_MSlR24Ca72xh4aNTAMHtrDU4-FJxsOLgrAXVTJ9sXoio_NDKCdp8qUBYV_1tf-z92Coa7Q8Vu1dhkAVJXet2Xh3ZgrjzDynky7AVnCqx-t785iXo2F_bRlHVOabObcwENlhWtg9zH21amTIzgYf&guccounter=2
- “Total Return Review”, Bianco Research, Posted 10/1/2025, https://www.biancoresearch.com/visitor-home/
- “Total Return Review”, Bianco Research, Posted 10/1/2025, https://www.biancoresearch.com/visitor-home/
- “Total Return Review”, Bianco Research, Posted 10/1/2025, https://www.biancoresearch.com/visitor-home/
- “How Many Americans Own Stock? About 162 Million -- but the Wealthiest 1% Own More Than Half”, Jack Caporal, Posted 9/22/2025, https://www.fool.com/research/how-many-americans-own-stock/
- “Consumer Spending Is Vital to GDP Growth”, Felix Richter, Posted 3/18/2025, https://www.statista.com/chart/18550/gdp-components/?srsltid=AfmBOooKh_DpfBCS6sPehizREPUTXBfLb-evxChFLvrniZinqsy47TYS
- “P/E10 and Market Valuation: September 2025”, Jennifer Nash, Posted 10/1/2025, https://www.advisorperspectives.com/dshort/updates/2025/10/01/pe10-market-valuation-september-2025
- “Sky-High S&P 500 Signals ‘New Normal,’ Not Bubble, BofA Says”, Alexandra Semenova, Posted 9/24/2025, https://www.bloomberg.com/news/articles/2025-09-24/sky-high-s-p-500-signals-new-normal-not-bubble-bofa-says?sref=YfRIauRL
- “Will a Stock Market Crash Follow the AI Boom? Billionaire Ken Griffin Warns About Echoes of the Dot-Com Bubble.”, Trevor Jennewine, Posted 9/30/2025, https://www.fool.com/investing/2025/09/30/stock-market-crash-after-ai-boom-billionaire-warns/
- “Chart of the Day: Q4 Strength”, Bespoke Investment Group, Posted 9/29/2025, https://www.bespokepremium.com/category/chart-of-the-day/