

In many regards, the fourth quarter of 2025 was a microcosm of the year as a whole. It was remarkable for its economic and geopolitical disruption, and perhaps even more remarkable for the ability and willingness of investors to ignore all of the uncertainty and chaos and to drive asset prices higher, almost regardless of asset class.
The two most notable exceptions to this generalization were the foreign bond markets, which averaged modest quarterly losses of -1.16%1, and crypto currencies like Bitcoin and Ether, which experienced among the worst quarterly losses in their history. Indeed, the total crypto market cap (the cumulative value of all crypto currencies) fell between 25-27% during the fourth quarter2.
Aside from these two asset classes, quarterly market returns were almost universally positive. The U.S. bond market, as represented by the Bloomberg Aggregate Index, gained 1.1%, domestic stock returns were strong, with gains ranging from over 4% for the normally stodgy Dow Jones Industrial Average to 2.2% for the chronically underperforming Russell 2000 Index of small company stocks. Healthcare stocks were particularly impressive, with average quarterly returns exceeding 11%3.
As was the case throughout 2025, fourth quarter foreign stock returns were even more impressive than those in the U.S., with foreign stock markets averaging gains of 5.2%. During the quarter, European stocks advanced an average of 6.2%, and developed markets in the Pacific (like Japan, Australia, and Hong Kong) gained 2.2%, while emerging market equities (like China, India, and Brazil) surged higher by more than 4.7%4.
So universal were positive returns in 2025 that it was arguably difficult for an investor to lose money. Large, mid, and small-cap domestic stocks, developed-market foreign stocks, emerging market stocks, high-yield bonds, investment-grade corporate bonds, treasury securities, and precious metals all posted positive returns during the year.
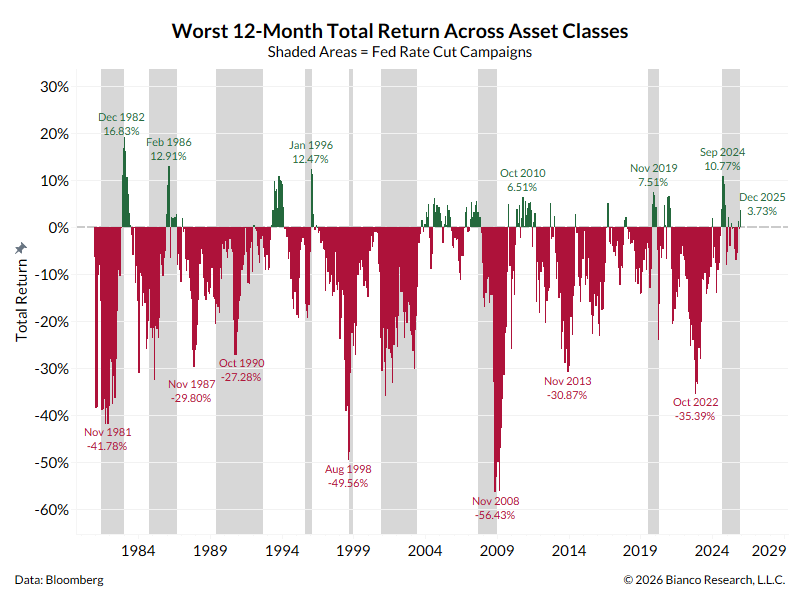
To put into perspective just how rare it is to see such a synchronous bull market, the worst performing of the aforementioned asset classes (for each respective year) are illustrated in the following chart. As you can see, there is almost always at least one asset class that experiences significant losses during a calendar year (red bars).
However, in 2025, the worst performing of these major asset classes was the 30-year Treasury bond, which still posted a positive total return for the year of 3.73%5.
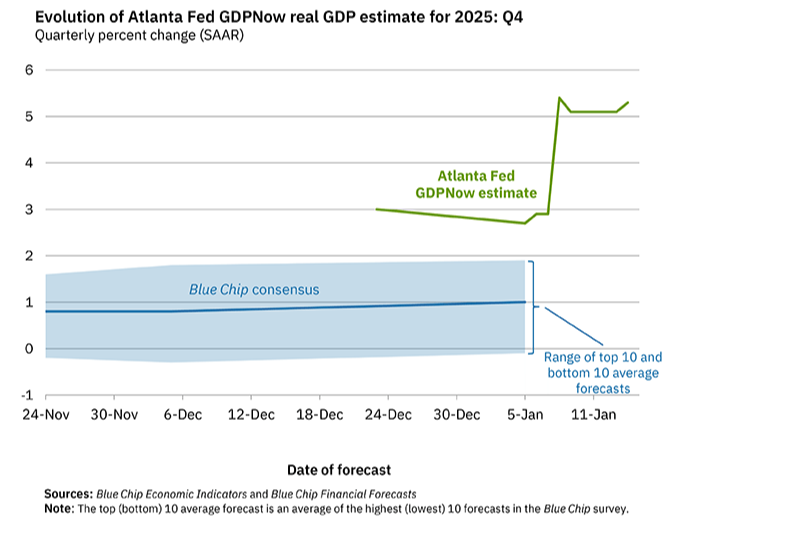
Importantly, it was not just the capital markets that exhibited strength in 2025, as the economic growth numbers in the U.S. were also extraordinary. According to the Commerce Department's Bureau of Economic Analysis, the U.S. economy (gross domestic product) increased at a blistering 4.3% annualized rate last quarter. Perhaps even more remarkable is the fact that it was sandwiched between a very hot second quarter growth rate of 3.8%6 and what could be an even hotter fourth quarter. According to the Atlanta Fed’s GDP Nowcast, fourth quarter growth is on track to come in around 5.3%.
While this fourth quarter number is likely being inflated by as much as 2%, due to the significant shrinkage in the trade deficit, it is still remarkable when you consider that the U.S. economy historically averages growth rates of only 2.0 to 2.5% per year. According to First Trust, excluding this huge (likely tariff-driven) drop in the trade deficit, “real GDP (economic growth net of inflation) is running at about 3% in Q4. And ‘Core GDP’, which excludes government purchases, inventories, and international trade, is heading for 2.5% growth7.”
Despite the fact that the economy is already running at an above average pace, and that it is already constrained by an incredibly tight labor market and very high levels of capacity utilization, both of which have historically suggested that an economic expansion is growing long in the tooth, the U.S. economy is expected to remain strong in 2026. This is in large part due to a combination of both monetary stimulus (further rate cuts by the Federal Reserve) and fiscal stimulus, including the One Big Beautiful Bill Act, which is expected to reduce income taxes by an average $2,000 per household, increase the availability of credit by deregulating banks, and boost corporate profit margins (by the estimated equivalent of a 7% corporate tax cut) by allowing the immediate expensing of “productive capacity” (i.e., factory, equipment, research and development, etc.)8.
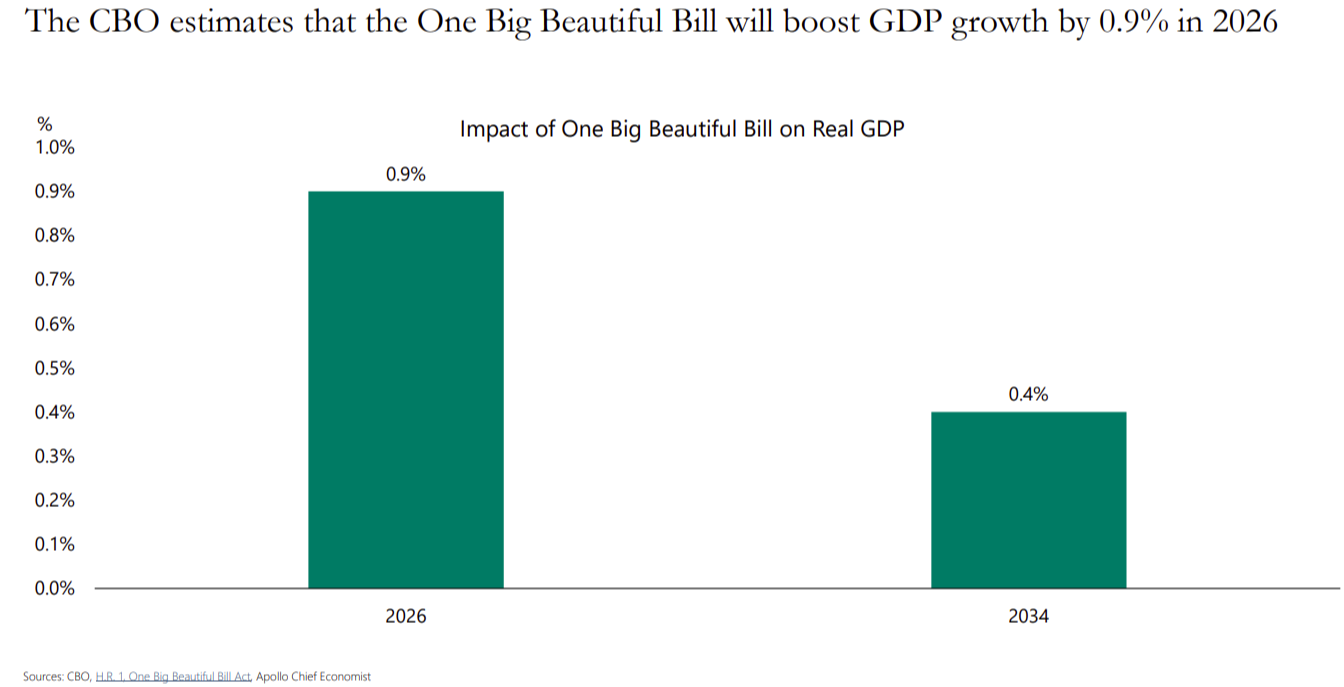
The One Big Beautiful Bill Act alone is expected to not only boost GDP (the size of the economy) by almost 1% in 2026, but to continue to stimulate the economy (and exacerbate the deficit) for years into the future. When you add in the likely impact of additional rate cuts by the Federal Reserve, the gains in worker productivity, the surge in federal deficit spending, stimulative policies in Europe and Japan, a depreciating U.S. dollar, and the build-out of the infrastructure necessary to support the future of artificial intelligence, it suggests yet another year of (the employment market aside) strong U.S. economic growth.
Arguably, most of the major foreign economies share a similarly optimistic outlook. J.P. Morgan’s head of global and European equity, Mislav Matejka, just noted that he expects “10% to 20% earnings growth for the euro zone in 2026, as earnings benefit from fiscal stimulus and improving financing conditions, tariff risks diminish, and China’s economy shows signs of stabilizing9.” In addition, Japan’s recently elected prime minister, Sanae
Takaichi, is pursuing very business-friendly programs designed to lower taxes and bolster investment, while the emerging market economies have historically benefitted from both strength in the developed world and from a falling U.S. dollar. In addition, many emerging markets, such as South Korea and Taiwan, allow investors a much less expensive avenue for investing in technology in general and artificial intelligence in particular.
Yes, there are many perceived reasons for investors to be optimistic about 2026, particularly with growing evidence that the global bull market in equities is continuing its expansion beyond the previous leadership of domestic mega-cap technology stocks. We are finding both value and opportunity in mid and smaller-capitalization stocks in both the U.S. and foreign markets, and also really like the prospects for many of the non-autocratic emerging markets (like South Korea, Taiwan, Brazil, and Poland). We are similarly bullish on metals and mining stocks, defense stocks (globally) and, of course, the beneficiaries of the secular integration of artificial intelligence. These include financial, healthcare, technology, and utility stocks.
As you can tell, our outlook is quite bullish, for equities in particular. However, we believe that there are also numerous reasons for some caution, starting with the fact that most of the aforementioned “good” news is already well known and therefore likely already largely reflected in equity prices.
Another issue is that bullishness is already very high. As noted in Bloomberg on December 29th, “at the big banks and the boutique investment shops, an optimistic consensus has taken hold: the US stock market will rally in 2026 for a fourth straight year, marking the longest winning streak in nearly two decades…after three years when the equity market’s rip-roaring run made a mockery of any bearish calls, sell-side strategists are marching in lockstep optimism, with the average year-end S&P 500 forecast implying another 9% gain next year. Not a single one of the 21 prognosticators surveyed by Bloomberg News is predicting a decline10.”
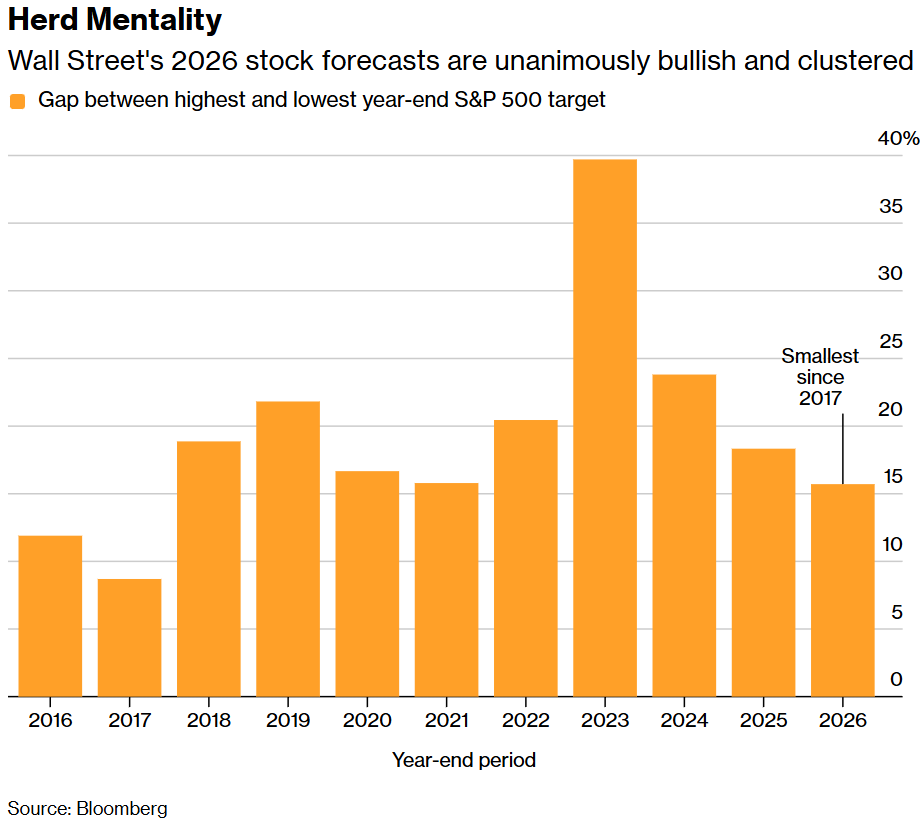
It is historically true that, when you run out of bears that can be converted into bulls, it often indicates that much of the investable cash is already invested. It is also worth remembering the cautionary words of legendary investor Bob Farrell that “when all of the experts and forecasts agree, something else is going to happen.” After all, markets are forecasting mechanisms that often reflect a future outcome into prices well in advance of the catalyzing events.
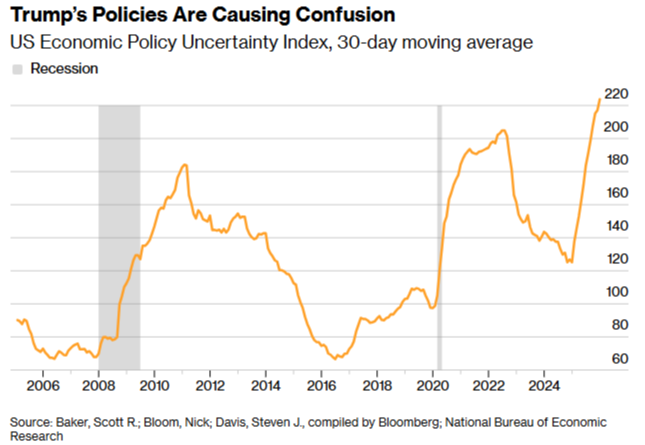
There is also the fact that there is enormous geopolitical and macroeconomic uncertainty at present, and that markets have traditionally abhorred uncertainty. Indeed, according to a December 9th report from Charles Schwab, “uncertainty” may be an understatement. As they put it, “the current economic and market cycle is characterized by instability rather than mere uncertainty. This instability manifests as rapid shifts in key determinants affecting economic sectors and consumers unevenly, leading to a K-shaped backdrop. We expect that to persist, creating heightened volatility and ongoing rotation within the stock market11.”
“Instability” may indeed be a better term. In the less than a year since President Trump returned to office, he has launched military operations against seven countries, including Venezuela, Syria, Iraq, Iran, Nigeria, Yemen and Somalia and, just since the start of the year, the U.S. has captured Venezuela’s president, Trump has threatened to invade Greenland (as revenge for his not receiving the Nobel Peace Prize), and launch a military attack on Iran, and that’s not even to mention his ever heightening assault on the independence of the Federal Reserve and his recent comments, since dismissed by his press secretary as a joke, that the U.S. should not hold mid-term elections.
That said, in 2025, virtually all investment markets managed to advance impressively, despite a similarly daunting array of headwinds, ranging from tariffs and trade wars to draconian immigration policies, a collapse in jobs creation, and a resurgence in inflation. They also overcame a general environment of uncertainty resulting from President Trump’s efforts to restructure much of both domestic policy and the world order in general. Throughout the year, investors showed a remarkable willingness to look through the chaos, and to instead concentrate on the more traditional drivers of equity prices, like earnings and interest rates.
Indeed, uncertainty may be exactly what the markets need to move higher, as stocks traditionally “climb a wall of worry”. The rationale is that the existence of worries keeps some cash on the sidelines, which can provide the fuel for the next move higher. This is why markets tend to be most susceptible to decline when there seems to be nothing left to worry about. We believe that the year 1999 provides a prime example of such an environment of dangerous over-confidence and complacency.
We are reminded of the sage wisdom of famed investor Robert Arnott, who noted that "in investing, what is comfortable is rarely profitable." There is much to be uncomfortable about today, which may be exactly what is needed to drive equity markets higher for the fourth year in a row. However, we are guarding against complacency and are keeping our head on a swivel. While we believe that the most likely scenario is for prices to meander higher, we expect market volatility to move higher as well.
Disclosures
Advisory services offered through Per Stirling Capital Management, LLC. Securities offered through B. B. Graham & Co., Inc., member FINRA/SIPC. Per Stirling Capital Management, LLC, DBA Per Stirling Private Wealth and B. B. Graham & Co., Inc., are separate and otherwise unrelated companies.
This material represents an assessment of the market and economic environment at a specific point in time and is not intended to be a forecast of future events, or a guarantee of future results. Forward-looking statements are subject to certain risks and uncertainties. Actual results, performance, or achievements may differ materially from those expressed or implied. Information is based on data gathered from what we believe are reliable sources. It is not guaranteed as to accuracy, does not purport to be complete and is not intended to be used as a primary basis for investment decisions. It should also not be construed as advice meeting the particular investment needs of any investor.
Nothing contained herein is to be considered a solicitation, research material, an investment recommendation or advice of any kind. The information contained herein may contain information that is subject to change without notice. Any investments or strategies referenced herein do not take into account the investment objectives, financial situation or particular needs of any specific person. Product suitability must be independently determined for each individual investor.
This document may contain forward-looking statements based on Per Stirling Capital Management, LLC’s (hereafter PSCM) expectations and projections about the methods by which it expects to invest. Those statements are sometimes indicated by words such as “expects,” “believes,” “will” and similar expressions. In addition, any statements that refer to expectations, projections or characterizations of future events or circumstances, including any underlying assumptions, are forward-looking statements. Such statements are not guarantying future performance and are subject to certain risks, uncertainties and assumptions that are difficult to predict. Therefore, actual returns could differ materially and adversely from those expressed or implied in any forward-looking statements as a result of various factors. The views and opinions expressed in this article are those of the authors and do not necessarily reflect the views of PSCM’s Investment Advisor Representatives.
Past performance is no guarantee of future results. The investment return and principal value of an investment will fluctuate so that an investor's shares, when redeemed, may be worth more or less than their original cost. Current performance may be lower or higher than the performance quoted.
Investing internationally carries additional risks such as differences in financial reporting, currency exchange risk, as well as economic and political risk unique to the specific country. This may result in greater share price volatility. Shares, when sold, may be worth more or less than their original cost.
Cryptocurrency is a digital representation of value that functions as a medium of exchange, a unit of account, or a store of value, but it does not have legal tender status. Cryptocurrencies are sometimes exchanged for U.S. dollars or other currencies around the world, but they are not generally backed or supported by any government or central bank. Their value is completely derived by market forces of supply and demand, and they are more volatile than traditional currencies. Cryptocurrencies are not covered by either FDIC or SIPC insurance. Legislative and regulatory changes or actions at the state, federal, or international level may adversely affect the use, transfer, exchange, and value of cryptocurrency.
Purchasing cryptocurrencies comes with a number of risks, including volatile market price swings or flash crashes, market manipulation, and cybersecurity risks. In addition, cryptocurrency markets and exchanges are not regulated with the same controls or customer protections available in equity, option, futures, or foreign exchange investing.
Definitions
Indices are unmanaged and investors cannot invest directly in an index. Unless otherwise noted, performance of indices does not account for any fees, commissions or other expenses that would be incurred. Returns do not include reinvested dividends.
The Standard & Poor's 500 (S&P 500) is a market-capitalization-weighted index of the 500 largest publicly-traded companies in the U.S with each stock's weight in the index proportionate to its market. It is not an exact list of the top 500 U.S. companies by market capitalization because there are other criteria to be included in the index.
The Russell 2000 Index is a small-cap U.S. stock market index that makes up the smallest 2,000 stocks in the Russell Index.
The Dow Jones Industrial Average (DJIA) is a price-weighted average of 30 actively traded “blue chip” stocks, primarily industrials, but includes financials and other service-oriented companies. The components, which change from time to time, represent between 15% and 20% of the market value of NYSE stocks.
The Nasdaq Composite Index is a market-capitalization weighted index of the more than 3,000 common equities listed on the Nasdaq stock exchange. The types of securities in the index include American depositary receipts, common stocks, real estate investment trusts (REITs) and tracking stocks. The index includes all Nasdaq listed stocks that are not derivatives, preferred shares, funds, exchange-traded funds (ETFs) or debentures.
The MSCI Emerging Markets (EM) Index is a float-adjusted market capitalization index that consists of indices in 21 emerging economies: Brazil, Chile, China, Colombia, Czech Republic, Egypt, Hungary, India, Indonesia, Korea, Malaysia, Mexico, Morocco, Peru, Philippines, Poland, Russia, South Africa, Taiwan, Thailand, and Turkey.
The Bloomberg US Aggregate Bond Index (or "the Agg") is a major, market-weighted benchmark for the U.S. investment-grade bond market, tracking U.S. Treasuries, government-related debt, corporate bonds, mortgage-backed securities (MBS), and asset-backed securities (ABS) with at least one year to maturity, serving as a key benchmark for many bond funds and ETFs.
The STOXX® Europe 600 is a broad measure of the European equity market. With a fixed number of 600 components, the index provides extensive and diversified coverage across 17 countries and 11 industries within Europe’s developed economies, representing nearly 90% of the underlying investable market.
TOPIX (TPX) is a market benchmark with functionality as an investable index, covering an extensive proportion of the Japanese stock market. TOPIX is a free-float adjusted market capitalization-weighted index. TOPIX shows the measure of current market capitalization assuming that market capitalization as of the base date (January 4 ,1968) is 100 points. This is a measure of the overall trend in the stock market, and is used as a benchmark for investment in japan stocks.
Small capitalization securities involve greater issuer risk than larger capitalization securities, and the markets for such securities may be more volatile and less liquid. Specifically, small capitalization companies may be subject to more volatile market movements than securities of larger, more established companies, both because the securities typically are traded in lower volume and because the issuers typically are more subject to changes in earnings and prospects.
Citations
- “Total Return Review”, Bianco Research, Posted 1/2/2026, https://www.biancoresearch.com/
- “Crypto’s “Best Quarter” Didn’t Show Up: Q4 2025 Wiped $1T As Bitcoin Slid And Institutions Split”, Alex Ioannou, Posted 1/9/2026, https://finance.yahoo.com/news/crypto-best-quarter-didn-t-210351868.html
- “Total Return Review”, Bianco Research, Posted 1/2/2026, https://www.biancoresearch.com/
- “Total Return Review”, Bianco Research, Posted 1/2/2026, https://www.biancoresearch.com/
- “Total Return Review: A Look Back at 2025”, Gregory Blaha, Posted 1/2/2026 https://www.biancoresearch.com/
- “US economic growth accelerates in third quarter”, Lucia Mutikani, Posted 12/23/2025, US economic growth accelerates in third quarter 12/23/25 Reuters PDF
- “Peering Through the Data Fog”, First Trust, Posted 1/12/2026, https://www.ftportfolios.com/Blogs/EconBlog/2026/1/12/peering-through-the-data-fog
- “Hopes Are High for 2026. What Could Go Wrong.”, Teresa Rivas, Posted 12/4/2026, https://www.barrons.com/articles/2026-stocks-fed-ai-6c3254a8
- “Alibaba, Kering, and 5 More International Bargain Stocks for 2026”, Reshma Kapadia, Posted 1/2/2026, https://www.barrons.com/articles/alibaba-kering-international-bargain-stocks-f678e7e5?lid=tk76ewtyokw5&mod=BAR_ENG_NAS_EML_BRNSDRMT_
- “Every Wall Street Analyst Now Predicts a Stock Rally in 2026”, Alexandra Semenova, Sagarika Jaisinghani, Posted 12/29/2026, https://www.bloomberg.com/news/articles/2025-12-29/bulls-only-every-wall-street-analyst-now-predicts-a-stock-rally?utm_medium=email&utm_source
- “2026 Outlook: U.S. Stocks and Economy”, Liz Ann Sonders, Kevin Gordon, 12/09/2025, https://www.schwabassetmanagement.com/story/us-stock-market-outlook