

Market pundits will often assign pithy nicknames to economic and/or market cycles. Recent examples include the “Dot-com Boom”, “the Global Financial Crisis”, “the Great Recession” and “the Great Reflation”. The most commonly repeated (and arguably highly appropriate) term used to describe the first quarter of 2025 may have been “the Great Reassessment”.
After all, the quarter started with the anticipation that President Trump’s second term would be very much like the first. There was a broad expectation that tariffs would turn out to be a rather small and manageable negative; that they would be only temporary, and that Trump was really only going to use them as a negotiating tool. There was an expectation of tax cuts, deregulation, and a very pro-business agenda. At the time, this seemed like a reasonable expectation, as this is a President who previously used the level of the stock market as a “scorecard” of his administration.
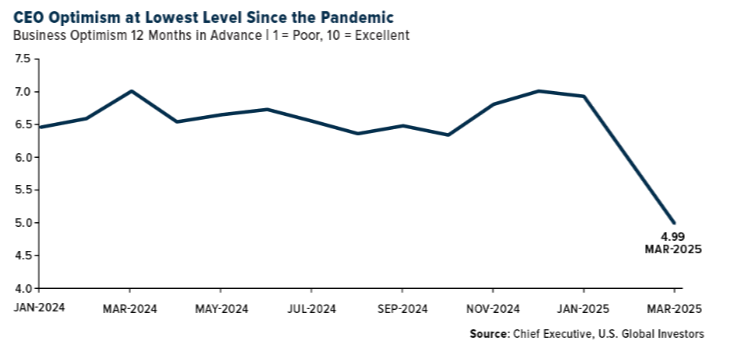
The first half of Q1 was notable for its surge in both “animal spirits” and confidence, as surveys of consumers, investors, small business owners and corporate CEOs soared to reflect heightened levels of bullishness and optimism. As noted, there was a broad expectation of very pro-business and pro-investor class policies, including income tax cuts and what President Trump promised to be the “most aggressive regulatory reduction” in the country’s history. 1
In addition, there was a belief that the Fed had successfully brought inflation back under control, which would allow them to continue cutting short-term interest rates, despite the fact that the economy was already growing at a very healthy rate of around 3%.
Bullishness in the domestic equity markets was so strong that, as of the February 19th year-to-date highs, the S&P 500 Index was up for the year by 4.2%, the Dow Jones Industrial Average by 4.7%, and the NASDAQ 100 by 4.8%. However, these impressive gains were not limited to larger stocks, as the recently under-achieving S&P 400 Mid-Cap Index and the S&P 600 Small-Cap Index were up on a year-to-date basis by 2.7% and 1.7% respectively. 2
It was in this mid-February timeframe when many investors, consumers and business managers apparently came to the realization that so many of the Trump policies that they were so optimistic about were likely to be delayed until at least late in the year (if implemented at all), and that the more disruptive, less business friendly, and more inflationary policies, like tariffs, deportations, downsizing the federal government and a restructuring of long-standing foreign policies were going to come first.
Moreover, this version of the President claims to not even watch the stock market. Instead, Trump is much more populist in his second term and appears to be pursuing policies designed to produce results that are more likely to benefit the average American (lower interest rates, a weaker U.S. dollar, which could help to reshore manufacturing jobs, and lower oil prices). By around mid-quarter, it had become evident that the President was so confident in the perceived long-term benefits of his agenda that he was willing to ignore the impact of his disruptive policies on the stock market, the dollar, the economy and business and consumer confidence.
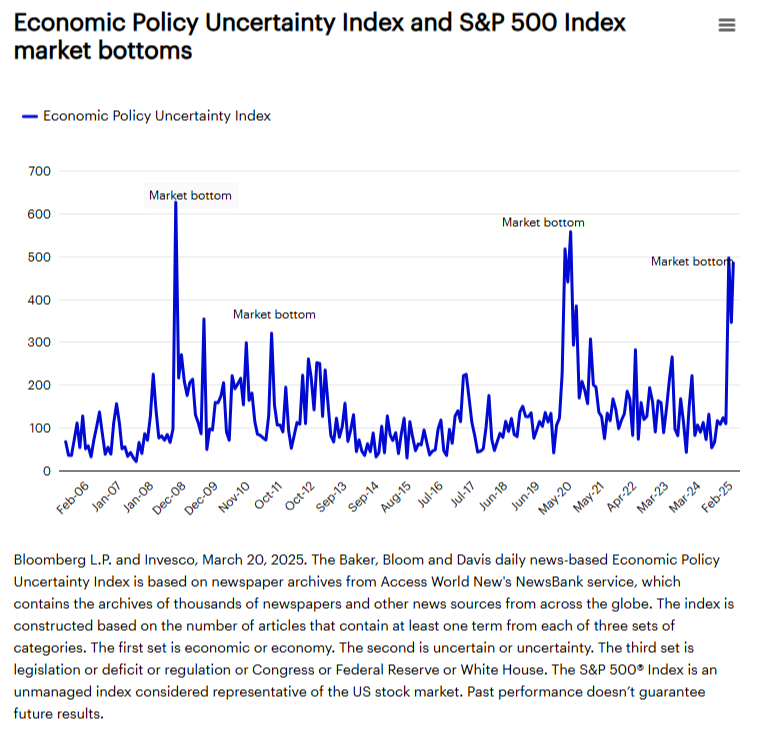
Investors traditionally loathe elevated levels of uncertainty, and we believe that the uncertainty that these policies have created was at least as disruptive as the policies themselves. Importantly, while elevated uncertainty is normally very disruptive to both the economy and the equity markets in the short term, investors may take some comfort from the fact that, while past performance is no guarantee of future results, there has historically been a fairly tight correlation between dramatic surges in the level of policy uncertainty and bottoms in the domestic equity markets.
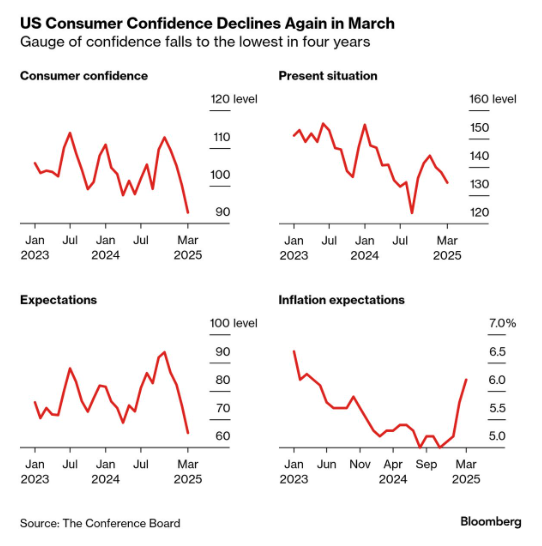
This heightened level of uncertainty first manifested itself in “soft data” like surveys, including those from the University of Michigan 3 and the Conference Board 4. As examples, we have included below the March Conference Board surveys of 1) consumer confidence, 2) confidence in one’s current financial situation, 3) confidence in one’s future financial prospects, and 4) expected average inflation over the next five to ten years.
This decline in confidence and optimism finally started impacting “hard data” during the first quarter, including a moderation in hiring plans, declining capital expenditures, reduced consumer spending, and slowing economic growth. That’s not even to mention the declining expectations for corporate earnings and a notable rebound in consumer inflation.
This “Great Reassessment” in thinking catalyzed a dramatic reversal in both the stock and bond markets. From the stock market’s February 19th peak to the end of the quarter, the S&P 500 Index lost -8.7%, the Dow Jones Industrial Average had lost -5.8%, and the NASDAQ 100 Index (which is heavily weighted towards the country’s largest technology-oriented companies) declined by 13.2%. Meanwhile, the S&P 400 Mid-Cap Index and S&P 600 Small Cap Index declined by -9.1% and -10.7% respectively. 5
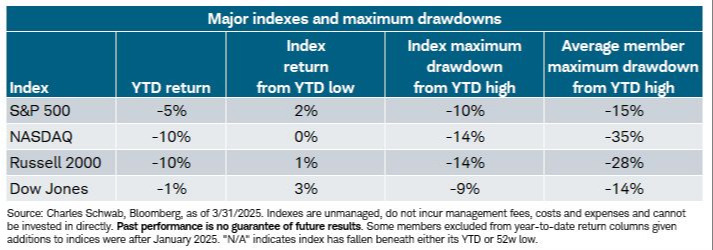
Remarkably, that may actually understate the depth of the decline when you consider that the average stock in the Standard & Poor’s 500 Index, the NASDAQ, the Russell 2000, and the Dow Jones Industrial Average fell by -15%, -35%, -28% and -14% respectively since their mid-quarter highs. It ended up being the worst quarter for domestic equities since 2022. 6 While the S&P 500 Index lost -4.3% and the Dow Jones Industrial Average lost a very modest -0.9%, smaller stocks, as represented by the Russell 2000 (-9.5%) and technology-oriented stocks, like those found in the NASDAQ (-10.3%), suffered much greater losses. 7
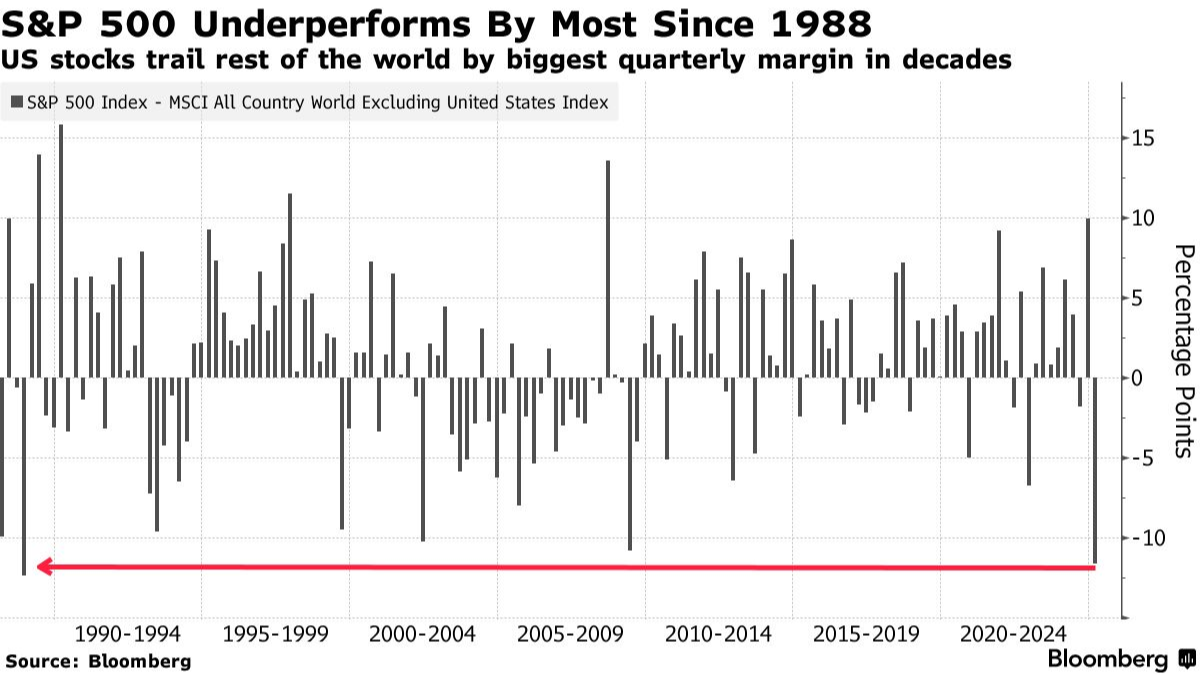
However, that is not to suggest that the quarter was without its winners. The fixed income markets, as represented by the Bloomberg Aggregate Bond Index (+2.8%), posted modest gains, while international stocks outperformed their domestic peers by the most since 1988. This was led by Europe, which averaged gains for the quarter of 10.5%. Other foreign equity market gains were more modest, with the average Asian market barely positive on the quarter and emerging markets (like China, India and Brazil) averaging quarterly gains of 2.9%. 8
Disclosures
Advisory services offered through Per Stirling Capital Management, LLC. Securities offered through B. B. Graham & Co., Inc., member FINRA/SIPC. Per Stirling Capital Management, LLC, DBA Per Stirling Private Wealth and B. B. Graham & Co., Inc., are separate and otherwise unrelated companies.
This material represents an assessment of the market and economic environment at a specific point in time and is not intended to be a forecast of future events, or a guarantee of future results. Forward-looking statements are subject to certain risks and uncertainties. Actual results, performance, or achievements may differ materially from those expressed or implied. Information is based on data gathered from what we believe are reliable sources. It is not guaranteed as to accuracy, does not purport to be complete and is not intended to be used as a primary basis for investment decisions. It should also not be construed as advice meeting the particular investment needs of any investor.
Nothing contained herein is to be considered a solicitation, research material, an investment recommendation or advice of any kind. The information contained herein may contain information that is subject to change without notice. Any investments or strategies referenced herein do not take into account the investment objectives, financial situation or particular needs of any specific person. Product suitability must be independently determined for each individual investor.
This document may contain forward-looking statements based on Per Stirling Capital Management, LLC’s (hereafter PSCM) expectations and projections about the methods by which it expects to invest. Those statements are sometimes indicated by words such as “expects,” “believes,” “will” and similar expressions. In addition, any statements that refer to expectations, projections or characterizations of future events or circumstances, including any underlying assumptions, are forward-looking statements. Such statements are not guarantying future performance and are subject to certain risks, uncertainties and assumptions that are difficult to predict. Therefore, actual returns could differ materially and adversely from those expressed or implied in any forward-looking statements as a result of various factors. The views and opinions expressed in this article are those of the authors and do not necessarily reflect the views of PSCM’s Investment Advisor Representatives.
The information presented is not intended to be making value judgements on the preferred outcome of any government decision or political election.
Past performance is no guarantee of future results. The investment return and principal value of an investment will fluctuate so that an investor’s shares, when redeemed, may be worth more or less than their original cost. Current performance may be lower or higher than the performance quoted.
Small capitalization securities involve greater issuer risk than larger capitalization securities, and the markets for such securities may be more volatile and less liquid. Specifically, small capitalization companies may be subject to more volatile market movements than securities of larger, more established companies, both because the securities typically are graded in lower volume and because the issuers typically are more subject to changes in earnings and prospects.
Investments in emerging markets may be more volatile and less liquid than investing in developed markets and may involve exposure to economic structures that are generally less diverse and mature and to political systems which have less stability than those of more developed countries.
Definitions
The Standard & Poor’s 500 (S&P 500) is a market-capitalization-weighted index of the 500 largest publicly-traded companies in the U.S with each stock’s weight in the index proportionate to its market. It is not an exact list of the top 500 U.S. companies by market capitalization because there are other criteria to be included in the index.
The Russell 2000 Index measures the performance of approximately 2,000 small-cap companies in the Russell 3000 Index, which is made up of 3,000 of the biggest U.S. stocks. The Russell 2000 serves as a benchmark for small-cap stocks in the United States.
This Standard & Poor’s Midcap 400 Index is a market weighted index that serves as a barometer for the U.S. mid-cap equities sector. To be included in the index, a stock must have a total market capitalization that ranges from roughly $750 million to $3 billion dollars. Stocks in this index represent household names from all major industries including energy, technology, healthcare, financial and manufacturing.
The S&P SmallCap 600 Index, more commonly known as the S&P 600, is a stock market index from Standard & Poor’s that covers the small-cap range of US stocks, using a capitalization-weighted index. The index covers roughly three percent of the total US stock market.
The Dow Jones Industrial Average (DJIA) is a price-weighted average of 30 actively traded “blue chip” stocks, primarily industrials, but includes financials and other service-oriented companies. The components, which change from time to time, represent between 15% and 20% of the market value of NYSE stocks.
The Russell 1000 Index measures the performance of the largest 1000 U.S. companies representing approximately 90% of the investable U.S. equity market.
The Nasdaq Composite Index is a market-capitalization weighted index of the more than 3,000 common equities listed on the Nasdaq stock exchange. The types of securities in the index include American depositary receipts, common stocks, real estate investment trusts (REITs) and tracking stocks. The index includes all Nasdaq listed stocks that are not derivatives, preferred shares, funds, exchange-traded funds (ETFs) or debentures.
The Bloomberg Barclays US Aggregate Bond Index, or the Agg, is a broad base, market capitalization-weighted bond market index representing intermediate term investment grade bonds traded in the United States. Investors frequently use the index as a stand-in for measuring the performance of the US bond market.
The Gross Domestic Product Price Index (GDP) measures changes in the prices of goods and services produced in the United States, including those exported to other countries. Prices of imports are excluded.
Indices are unmanaged and investors cannot invest directly in an index. Unless otherwise noted, performance of indices does not account for any fees, commissions or other expenses that would be incurred. Returns do not include reinvested dividends.
Citations
- “Trump vows anti-reg blitz”, Robin Bravender, Posted 11/04/2024, https://www.eenews.net/articles/trump-vows-anti-reg-blitz/
- “The Closer”, Bespoke Investment Group, Posted 3/31/2025, https://www.bespokepremium.com/category/the-closer/
- “Surveys of Consumers”, University of Michigan, Posted 02/01/2025, https://data.sca.isr.umich.edu/charts.php
- “US Consumer Confidence tumbled again in March”, The Conference Board, Posted 3/25/2025, https://www.conference-board.org/topics/consumer-confidence
- “The Closer”, Bespoke Investment Group, Posted 3/31/2025, https://www.bespokepremium.com/category/the-closer/
- “The Way Forward”, Greg Bartalos. Posted 4/1/2025, https://www.barrons.com/podcasts/barrons-advisor?page=1&
- “Total Return Review”, Bianco Research, Posted 4/1/2025, https://www.biancoresearch.com/visitor-home/
- “Total Return Review”, Bianco Research, Posted 4/1/2025, https://www.biancoresearch.com/visitor-home/